
Two Kinds of Job
How to get things done in a data role when people won't stop asking you questions

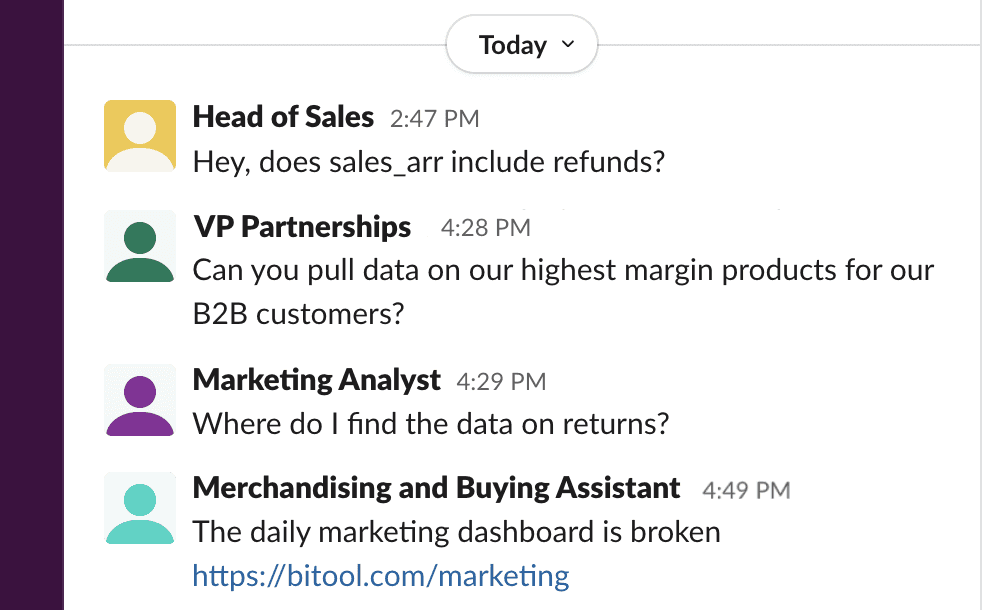
What was the most frustrating part of working in our data team? Slack DMs.
Those well-meaning, but oh-so-annoying messages we got from business users.
In an attempt to stem the tide, we actually tried to ban them. As you may have guessed, it didn't work. Why are these messages so detrimental, and why didn't the people messaging us get it?
Makers and Managers are on Different Schedules
In any office, there are two kinds of jobs: Paul Graham calls them Managers and Makers. What distinguishes them is the way they manage their time.
- Managers happily divide up their days into hour-long or half-hour units. They do lots of meetings: with customers, leads, partners and their internal teams. A day with 6 hours of meetings can be highly productive.
- Makers work best in uninterrupted time blocks. You can't make high-quality artifacts where detail matters without focus. A day with 3 meetings can be a write-off.
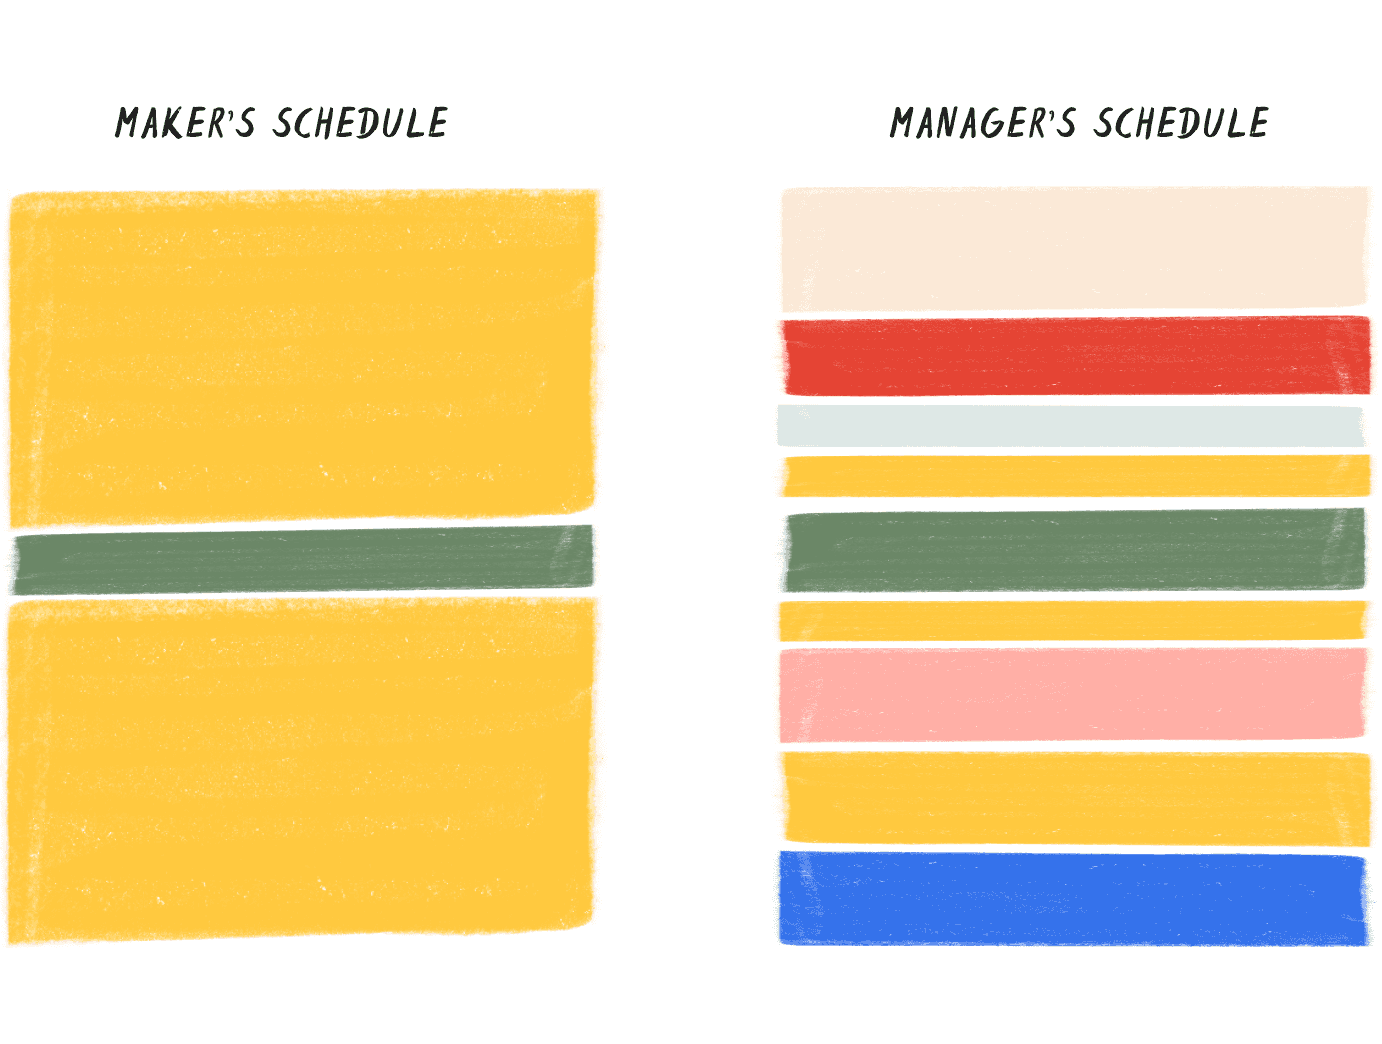
I think the labels here are a bit simplistic. To the manager category, I'd also add roles where you create value by listening and talking directly with others, such as salespeople, product managers and any consultant. Call them Communicators. Most stakeholders that data teams work with are communicators - they don't understand the schedule of a maker.
Makers include roles like copywriters, designers and software engineers. Unlike communicators, interrupting Makers costs them a lot, as it breaks their focus, which takes time to get back.
Data Professionals have to be Makers and Communicators
Life in a data team doesn't fall cleanly into one of these boxes.
To be effective stewards of data, you need to:
- Create the data that your colleagues see
- Tell them what data they are looking at, what it means and how to use it
It should be no surprise that data teams are in a tricky spot. They need to produce like makers but have availability like communicators.
So how do you do it?
Prevent Fragmented Data Tooling Disrupting How You Work
The first part is making sure when we have time, we use it effectively.
With limited time to make and maintain our data assets, we need to have a seamless way of building those data assets.
But we don't. The proliferation of tooling in data has led to hopping around lots of apps to get things done. For us, these included:
- Snowflake's console to manage permissions and see what tables and columns existed
- dBeaver for writing and developing scratch queries
- VSCode or Atom (RIP) as another IDE for dbt models
- Github to review and merge changes to data models
- Metabase and Looker to drag and drop columns into charts, and make dashboards.
Driving around those tabs and windows means we are constantly context switching, and costs us precious focus.
Communicate at Scale Rather than One-on-One
Part two is trying to scale up how you communicate.
Slack DMs are the result of uncertainty. Users don't know where data is, what they are looking at, or how to use it.
As in medicine, though, prevention is better than the cure. You should be able to explain your data to your users before they ask.
In our team, we thought that was a solved problem: Software engineers explain how their software works with documentation. We should be able to do the same with data.
We invested significantly in writing documentation and found it didn't work: We hated writing it and business users didn't read it. Trying to write labels for the columns in one table is an exhausting task, and results in descriptions that are mainly human-readable translations of the SQL that defines them.
Documentation like this is doomed because it's the wrong medium. For data documentation to work you need to be able to write alongside the data: to add narrative, context and caveats. Many slideshows presentations simply solve the problem of co-locating data and images with text, rather than sending the raw Excel file.
The issue with slideshows is that they are not scalable. They don't update.
Getting More Done with Evidence
These are two of the problems we set out to work on at Evidence. How to create a work patterns for data teams, and provide them with better ways to communicate.
Evidence is the Antidote to Context-Switching
We're integrating Evidence deeply with developer tooling so you can build data products without having to hop-hop-hop.
Our latest features focus on VSCode, currently the most popular IDE with 74% of developers using it according to Stack Overflow.
Install from VSCode, Launch in Seconds
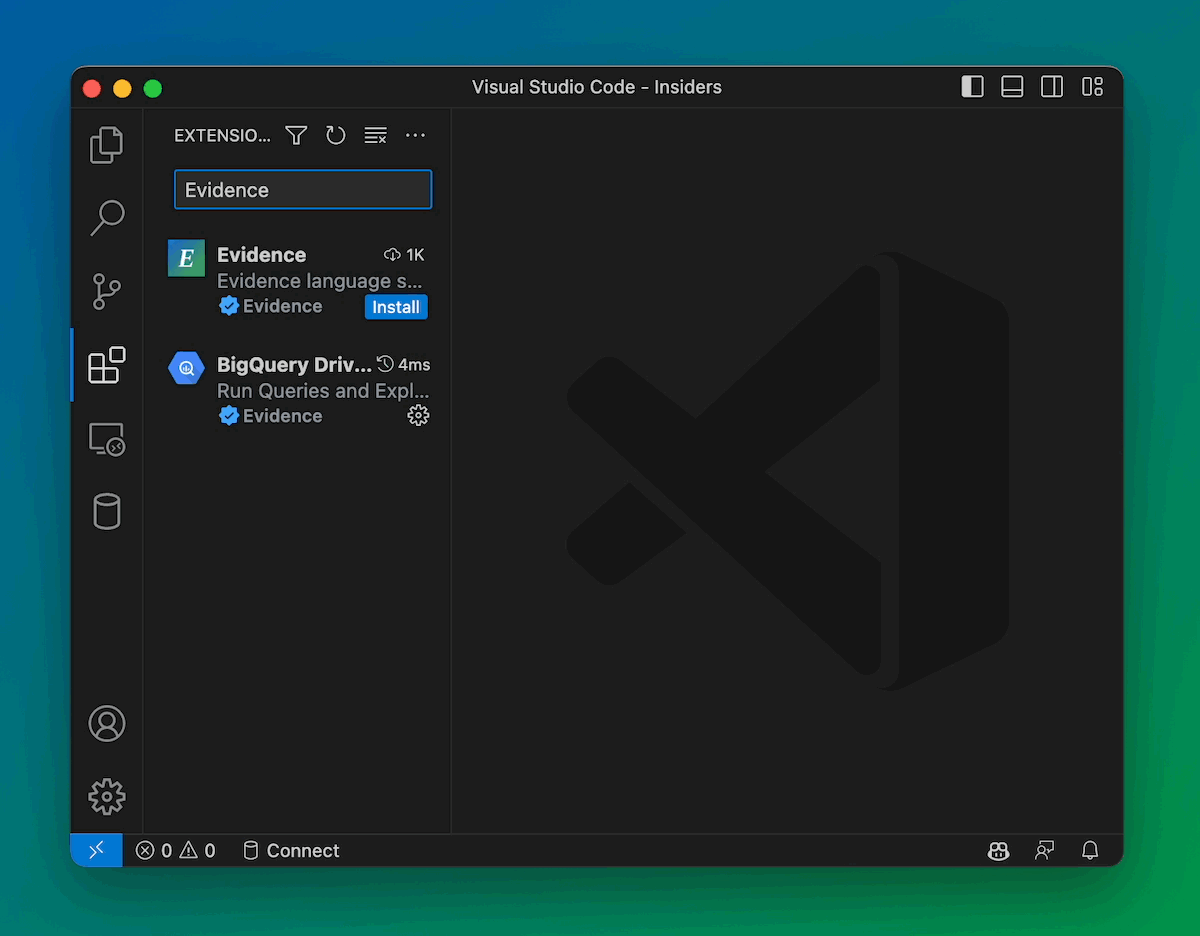
You can now get Evidence straight from the VSCode Marketplace, and start building reports instantly.
SQL and Reports Side by Side
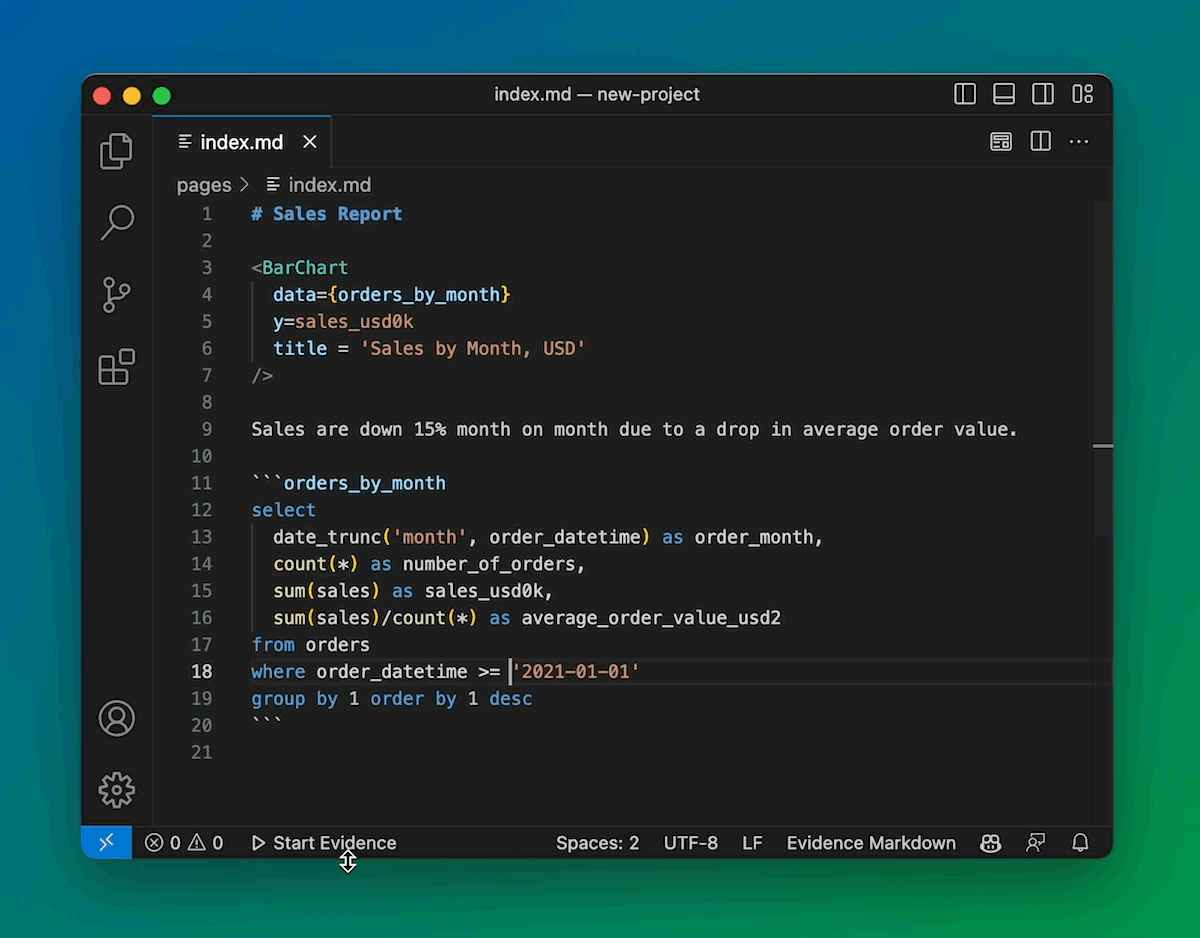
You don't have to write SQL first, and then visualize it. It's better to work on them together so you can iterate.
Slash Commands and Keyboard Shortcuts
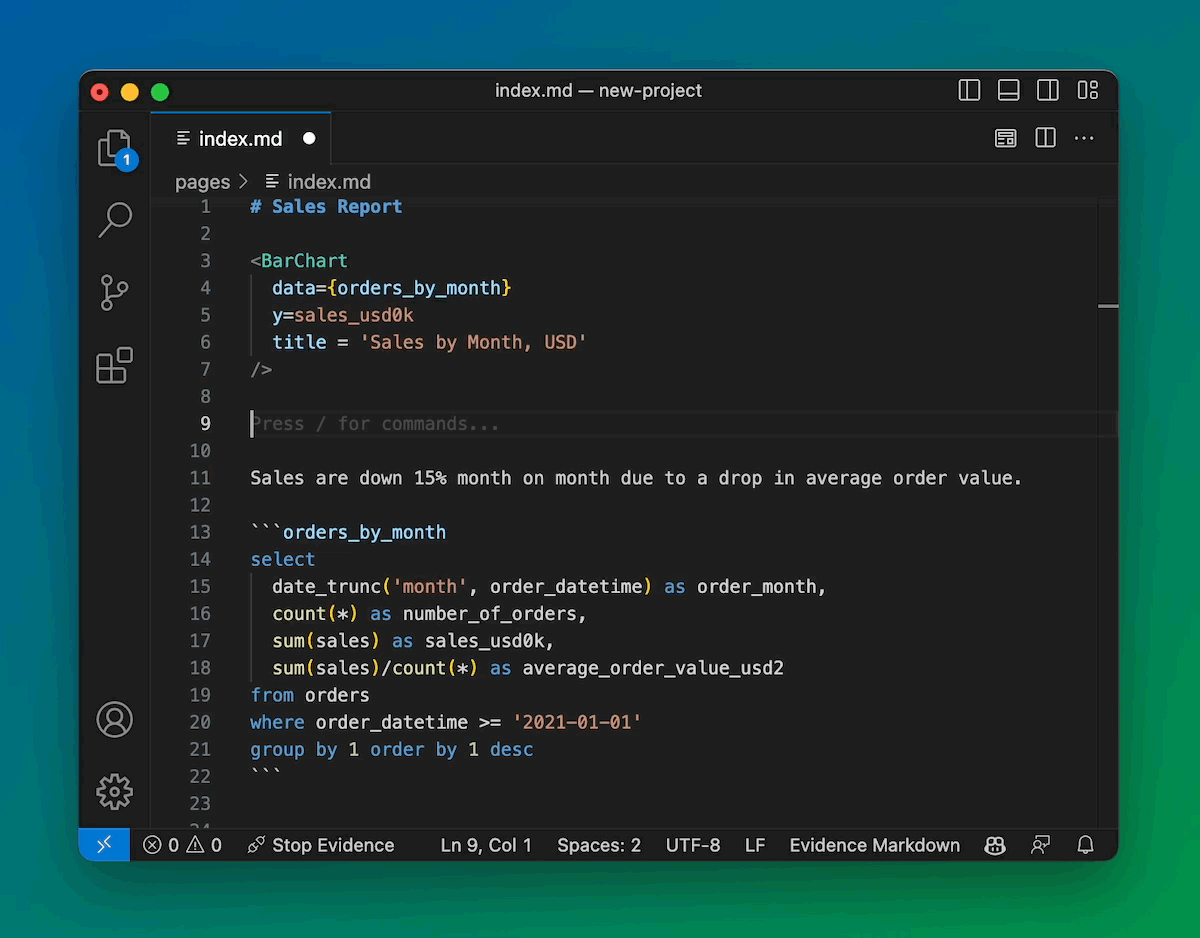
Type a slash to quickly insert a component. Start Evidence with Ctrl + R.
(Coming soon) Explore and Run your Database inside VSCode
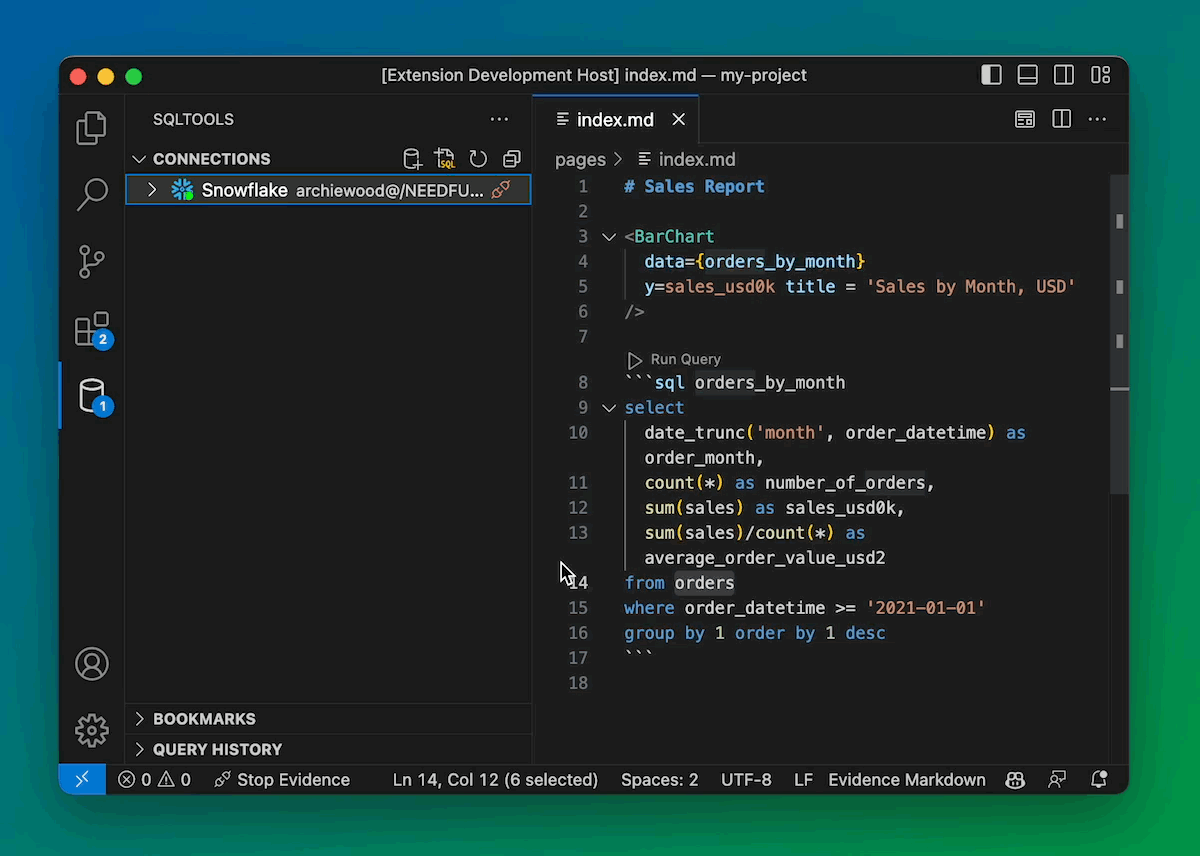
We're integrating with the excellent VSCode SQLTools ecosystem so you can close that console altogether.
Evidence is a Communication Tool for Data
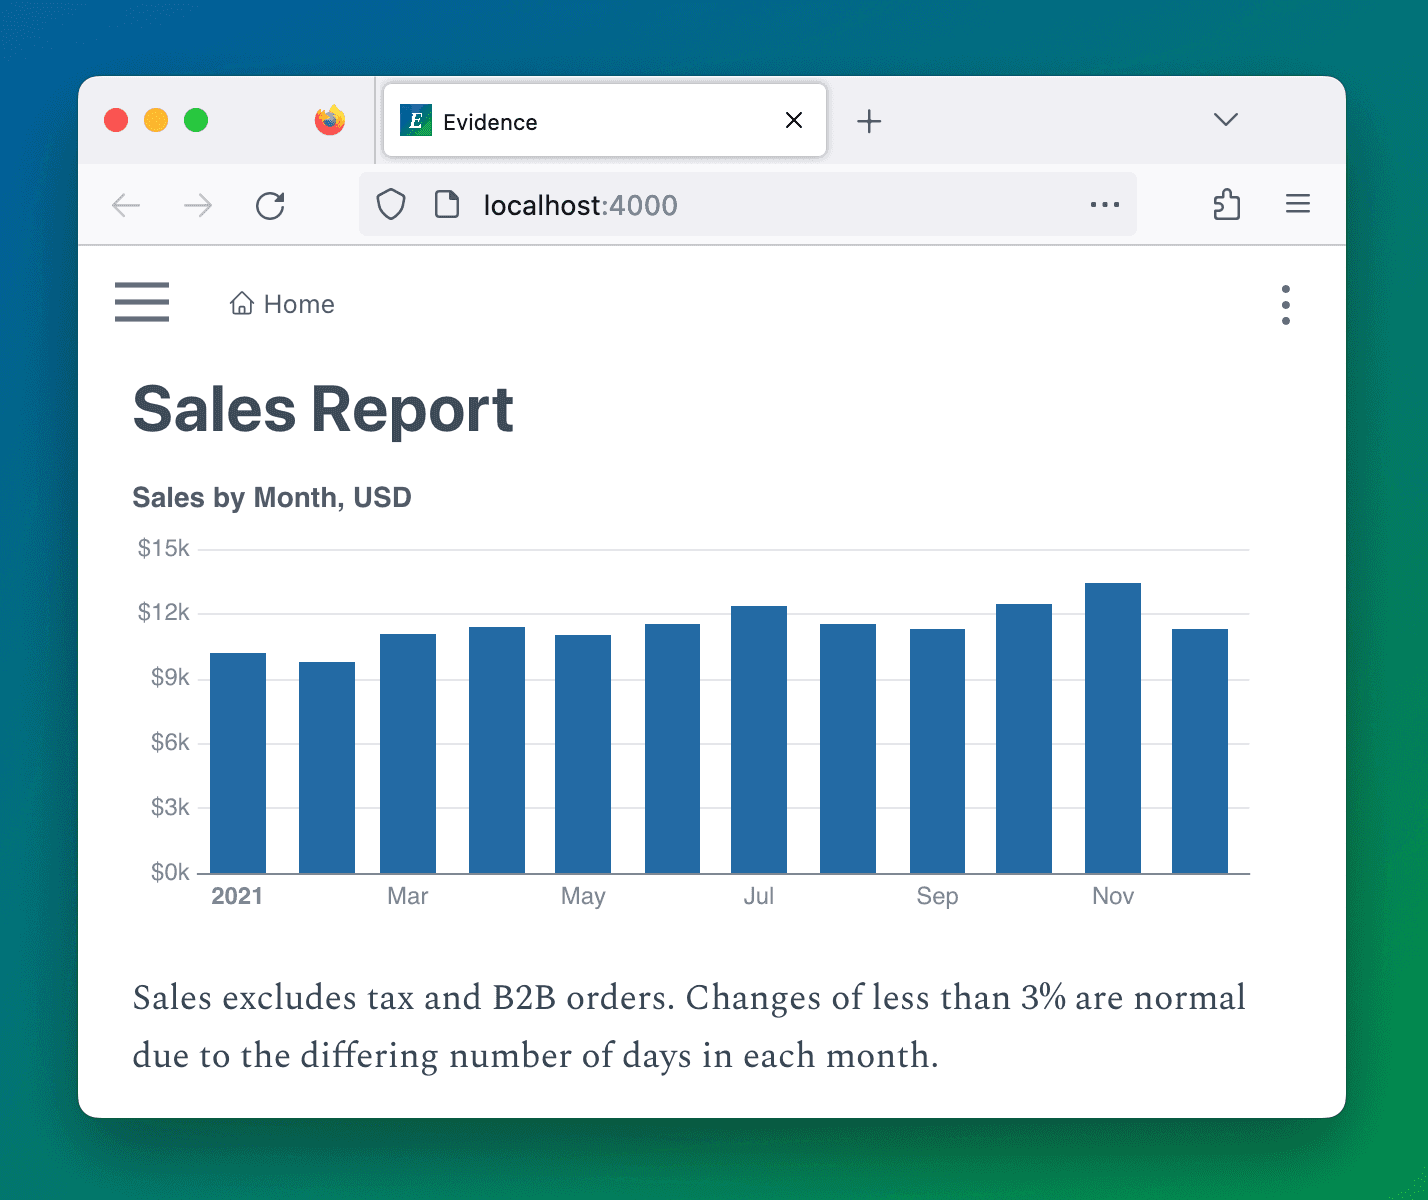
Evidence has a live connection to your data, and gives you the space to add your context and narrative inline. Get your data in SQL. Add titles, labels, and paragraphs, wherever they are needed. It's a more fulfilling way to work, and your stakeholders will engage with it.
Don't settle for working on a manager's schedule, get Evidence.
